Extended and Priced In?
Analyst are have been raising price targets for 2H 2023 and expect earnings to go higher. This is interesting given the lag effects of rate hikes, exhaustion of excess household savings, and student loan repayment starting back up. However, this is a plausible scenario so let's consider it.
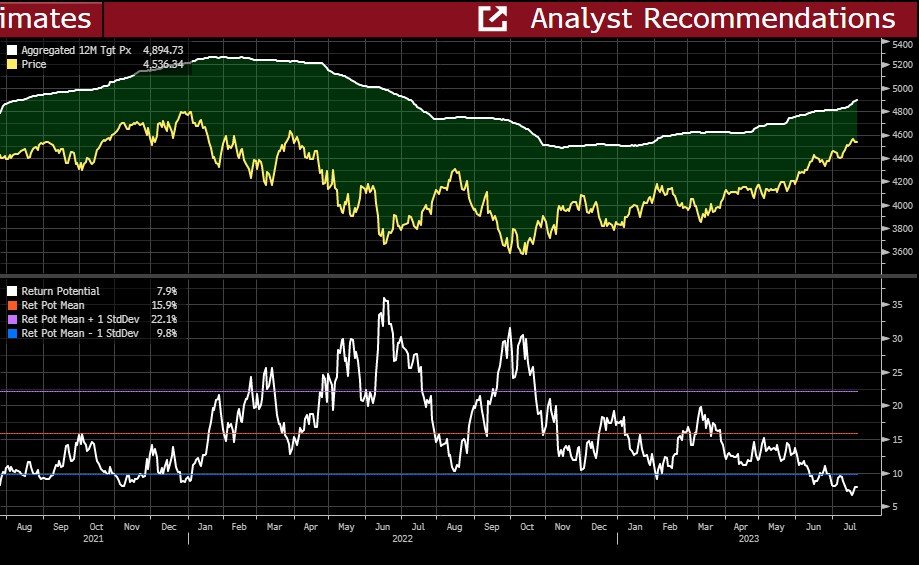
In the chart below. As price targets for stocks (displayed here by the S&P 500) has increased, the current price has risen much faster.
Now the 2nd chart is "Return Potential" which is the difference between the Current Price and the consensus target price. You may notice a very close INVERSE relationship between Return Potential and the actual Price of the index.
Why is that?
Because analysts typically lag in adjusting estimates while the current price moves much faster, just like what's happened over the last 6 months.
Here's the interesting part. The closer the current price is to the target price, that typically a LOWER Return Potential because the "good news" or "speculation" is getting priced in faster than the target price is being raised. Similarly, the farther away the current price is from the target, the HIGHER the Return Potential.
So it's the expansion and contraction on these two series that can give us an idea of where things are headed.
And when Return Potential goes below 1 std dev from average, we typically see a pullback. We are below that now, so it's another measure that confirms markets are overextended and due for a correction of some kind.